

Trump's Budget
POSTED BY: JEWELSTAITEFAN
UPDATED: Monday, July 13, 2026 16:10
VIEWED: 32160
PAGE 21 of 32

In case there were any remaining doubts about whether Trump's tax cut would pay for itself, it hasn't.
The massive 27 percent deficit increase from last year is only expected to worsen as Trump's $1.5 trillion tax plan from a year-and-a-half ago fails to "pay for itself" as the White House previously claimed.
www.newsweek.com/conservatives-criticize-republican-federal-deficit-tr
ump-spending-record-congress-debt-tax-cuts-1454024
The Joss Whedon script for Serenity, where Wash lives, is Serenity-190pages.pdf at www.mediafire.com/folder/1uwh75oa407q8/Firefly
NOTIFY: Y | REPLY | REPLY WITH QUOTE | PERMALINK | TOP | HOME

And with new GDP data from 26 July, which does not add up, so it must be partially wrong:
$201.0 B for 2019Q2 (est). More than I expected, and enough to surpass the 4-Quarter $1 T Mark.
The 4th consecutive Quarter showing the prior 4 Quarters increased more than $1 Trillion GDP - which never before happened in a 4 Quarter span.
The last several reports have been persistently rounding off the figure totals by 3 or 4 digits, so that the figures I'm posting are based upon addition, stacked many times, and could be subject to correction.
Here I'll include a column showing how far behind the pace the Obamanomics years were.
Quote:
Originally posted by JEWELSTAITEFAN:
This data does appear to be listed under Calendar Year Quarters as opposed to Fiscal Year Quarters elsewhere.
Yes, this is Table.1.1.5 (use the Modify button to adjust dates) at this link:
https://bea.gov/iTable/iTable.cfm?
This GDP data is from BEA News Release Archives. Current-Dollar GDP.
I noticed a trend among the BEA data. The figures from BEA do not match other info. But they make monthly reports, each Quarter has an Advanced Estimate, then 2nd Estimate, then 3rd Estimate, before the final figure.
With new data from 27 July 2018:
Yr FY Qrtr1 FY Qrtr2 FY Qrtr3 FY Qrtr4 FiscalYr CalndrYr Paced FY
00 09890.4 10002.9 10247.7 10319.8 10107.4 10252.3
01 10439.0 10472.9 10597.8 10596.3 10526.5 10581.8 10659.7 --133
02 10660.3 10789.0 10893.2 10992.1 10833.6 10936.4 11212.0 --380
03 11071.5 11183.5 11312.9 11567.3 11283.8 11458.2 11764.3 --460
04 11769.3 11920.2 12109.0 12303.3 12025.4 12213.7 12316.5 --291
05 12522.4 12761.3 12910.0 13142.9 12834.1 13036.6 12868.8 --55
06 13332.3 13603.9 13749.8 13867.5 13638.4 13814.6 13421.1 +217
07 14037.2 14208.6 14382.4 14535.0 14290.8 14451.9 13973.3 +317
08 14681.5 14651.0 14805.6 14835.2 14743.3 14712.8 14525.6 +218
09 14559.5 14394.5 14352.9 14420.3 14431.9 14448.9 15077.9 --646
10 14628.0 14721.4 14926.1 15079.9 14838.8 14992.3 15630.2 --791
11 15240.8 15285.8 15496.2 15591.9 15403.7 15542.6 16182.5 --779
12 15796.5 16019.8 16152.3 16257.2 16056.4 16197.0 16735.8 --679
13 16358.9 16569.6 16637.9 16848.7 16944.3 16784.9 17288.1 --344
14 17083.1 17102.9 17425.8 17719.8 17392.7 17521.7 17840.3 --448
15 17838.5 17970.4 18221.3 18331.1 18090.3 18219.3 18392.6 --302
16 18354.4 18409.1 18640.7 18799.6 18551.0 18707.2 18944.8 --394
17 18979.2 19162.6 19359.1 19588.1 19272.3 19485.4 19497.1 --225
18 19831.8 20041.0 20411.9 20658.2 20210.7 20500.6 20049.4 +161
19 20865.1 21066.1 2134?.?
This data meshes well. Taking the average of the 4 FY Quarters produces the FY figure listed by Treasury, except for FY 2017. This is because each quarter has the data multiplied by 4, to present as a full year's rate.
Something to note: Obama constantly projected that he would generate repeated increases to GDP of over $1 Trillion from one year to the next. Yet Obamanomics never allowed growth like that to occur. Not one single year did the GDP grow by $1 Trillion. Not during Obamanomics, nor ever before. But Trump accomplishes this feat, in only his very first full year - even though Obama's overly optimistic predictions did not identify it would be possible this soon.
Peak Quarters of growth: (including all-time Top 10 prior to Trump)
370.9 FY2018 Q3 (new data)
322.9 FY2014 Q3
294.0 FY2014 Q4
27?.? FY2019 Q3 (est)
271.6 FY2006 Q2
254.4 FY2003 Q4
250.9 FY2015 Q3
246.3 FY2018 Q4
244.8 FY2000 Q3
243.7 FY2018 Q1
238.9 FY2005 Q2
234.4 FY2014 Q1
232.9 FY2005 Q4
233.2 FY2019 Q1 (est)
231.6 FY2016 Q3
229.0 FY2017 Q4
NOTIFY: Y | REPLY | REPLY WITH QUOTE | PERMALINK | TOP | HOME
Quote:You are ignoring inflation. If you look at percent change it becomes very obvious that the growth of GDP is below average during the Trump administration:
Originally posted by JEWELSTAITEFAN:
So it looks clear that Trump is the only President to accomplish more than $875 Billion of GDP Growth in any 4-Quarter period. And he did it in only his very first full 4 Quarters. Apparently some here claim that this must be attributed to Bush43 - but most reasonable people can see that is fallacy.
Further, the first 5 periods of 4 full Quarters of Trump are the 5 largest such gains in history.
Which Obama succeeded in avoiding. His 23rd and 25th such periods were the best in history (using the Obamanomics devalued $), at the time (now 5th & 6th best). His 27th such period was 10th best at the time (now 15th best). Even after all his work to devalue the $, his dismal performance could not rise in that metric. His goal to lower the tide in order to make his shipwrecks stand taller did not work.
GDP Percent Change from Quarter One Year Ago
https://fred.stlouisfed.org/graph/?g=oDVt

The Joss Whedon script for Serenity, where Wash lives, is Serenity-190pages.pdf at www.mediafire.com/folder/1uwh75oa407q8/Firefly
NOTIFY: Y | REPLY | REPLY WITH QUOTE | PERMALINK | TOP | HOME
Quote:That graph does not seem to display what you think it does.
Originally posted by second:Quote:You are ignoring inflation. If you look at percent change it becomes very obvious that the growth of GDP is below average during the Trump administration:
Originally posted by JEWELSTAITEFAN:
So it looks clear that Trump is the only President to accomplish more than $875 Billion of GDP Growth in any 4-Quarter period. And he did it in only his very first full 4 Quarters. Apparently some here claim that this must be attributed to Bush43 - but most reasonable people can see that is fallacy.
Further, the first 5 periods of 4 full Quarters of Trump are the 5 largest such gains in history.
Which Obama succeeded in avoiding. His 23rd and 25th such periods were the best in history (using the Obamanomics devalued $), at the time (now 5th & 6th best). His 27th such period was 10th best at the time (now 15th best). Even after all his work to devalue the $, his dismal performance could not rise in that metric. His goal to lower the tide in order to make his shipwrecks stand taller did not work.
GDP Percent Change from Quarter One Year Ago
https://fred.stlouisfed.org/graph/?g=oDVt
Trump's period seems to remain above the average, unlike Obamination's sporadic jumps and dips.
NOTIFY: Y | REPLY | REPLY WITH QUOTE | PERMALINK | TOP | HOME
Quote:Look at Reagan's. Look at Bush's. Look at Clinton's. Look at Bush II's.
Originally posted by JEWELSTAITEFAN:
GDP Percent Change from Quarter One Year Ago
https://fred.stlouisfed.org/graph/?g=oDVt
That graph does not seem to display what you think it does.
Trump's period seems to remain above the average, unlike Obamination's sporadic jumps and dips.
ALL OF THEM ARE HIGHER THAN TRUMP'S. If you cannot see that, get glasses.
The Joss Whedon script for Serenity, where Wash lives, is Serenity-190pages.pdf at www.mediafire.com/folder/1uwh75oa407q8/Firefly
NOTIFY: Y | REPLY | REPLY WITH QUOTE | PERMALINK | TOP | HOME
The budget office said on Wednesday that it expects growth of 2.6 percent this year and 2.1 percent in 2020, well below the more than 3 percent growth the Trump administration has promised for those years.
The deficit will reach $960 billion for the 2019 fiscal year, which ends Sept. 30, and $1 trillion for the 2020 fiscal year, the Congressional Budget Office said in updated forecasts released on Wednesday.
Mr. Trump’s deficits have shattered his campaign promise to not only balance the budget, but to pay off the entire national debt. His fellow Republicans insist they will return to shrinking the deficit if Mr. Trump wins a second term in office.
www.nytimes.com/2019/08/21/us/politics/deficit-will-reach-1-trillion-n
ext-year-budget-office-predicts.html
The Joss Whedon script for Serenity, where Wash lives, is Serenity-190pages.pdf at www.mediafire.com/folder/1uwh75oa407q8/Firefly
NOTIFY: Y | REPLY | REPLY WITH QUOTE | PERMALINK | TOP | HOME
Reposted for top of the page reference:
Budget. Trump's FY2020, with forecasting and projections to 2029
From 11 March 2019, Office of Management and Budget.
The new CBO report is from January 2019. It is https://www.cbo.gov/publication/54918
For comparison, I'll post on the same Table as Trump's projections. This is in the middle section.
The left has President's Federal Budget, FY2019, and then the CBO Budget and Economic Outlook and Updates from January 2019, and then Trump's FY2020 Budget and Projections from OMB on 11 March 2019.
Year Rvnu Outl Defct NtGDP || CBR CBOt CBOD CBDb CBGDP || Rvnu Outl Defct FdGFD NtGDP
2029 8888 8888 888 88888 || 5672 7042 1370 33681 31006 || 6292 6495 0202 31506 34727
2028 5818 6181 363 32602 || 5446 6881 1435 32581 29862 || 5939 6447 0508 31195 33116
2027 5506 5955 450 31089 || 5254 6446 1192 31353 28738 || 5608 6122 0513 30695 31580
2026 5231 5748 517 29647 || 4956 6160 1204 30331 27667 || 5323 5899 0577 30128 30116
2025 4946 5526 579 28253 || 4647 5859 1212 29175 26656 || 5040 5671 0631 29386 28700
2024 4675 5348 672 26900 || 4448 5539 1091 28020 25642 || 4753 5453 0700 28582 27326
2023 4386 5160 774 25605 || 4208 5347 1139 26922 24672 || 4421 5330 0909 27645 26007
2022 4089 4941 852 24369 || 4012 5140 1128 25759 23778 || 4129 5177 1049 26544 24753
2021 3838 4754 916 23194 || 3841 4814 0973 24598 22939 || 3877 4945 1068 25333 23558
2020 3609 4596 987 22067 || 3686 4589 0903 23522 22120 || 3645 4746 1101 24057 22410
2019 3422 4407 984 21003 || 3515 4412 0897 22465 21252 || 3438 4529 1092 22776 21289
2018 3340 4214 873 20029 || 3329 4108 0779 21461 20236 || 3330 4109 0779 21462 20236
2017 3316 3982 665 19177 ||
In the left section, Trump's Budget, compared to Obama projections:
The Revenue projections are reduced from the exaggerated amounts Obama assumed. Deficits upcoming are increased due to more realistic projections. For 2017 the figures were updated from Obama's base projections and last year corrections. Trump's GDP is revised up, and Expenditures are revised down.
Trump's Budget accumulates $8.632 Trillion in Deficits by 2028.
Indicating the Federal Debt would add about $13 Trillion in that period.
Which holds true to historical practice. Democrats always exaggerate or overestimate Revenues and downplay or underestimate Expenditures, and Conservative Republicans always underestimate Revenue projections and overestimate Expenditure projections (but Democrats then find some pork to fill in the difference).
In the middle section, the CBO Analysis from May 2018:
The Liberal biased practices of the CBO bloat the Expenditures, and undervalue the Revenues and long-term GDP, thus exaggerate the Deficits. The GDP in the short term is more because even the Liberal bias was unable to deny the reality of Trump's Fiscal Policies and subsequent GDP growth.
The CBO projections bloat the accumulative Deficits to $13.888 Trillion by 2028. The CBO Analysis projects $11.033 Trillion accumulated Deficits by 2028.
Indicating the Federal Debt would add about $16 Trillion in that period.
Which would exaggerate by $3 Trillion what Trump's Budget projected.
The section to the right is the CBO Analysis of Trump's Budget, from January 2019.
Because the numbers from BEA are not used in the President's Federal Budget during this century, the relevant figures had to be interpolated. For this reason the 20,029 would be replaced by 20,103. An increase of $74 Billion for 2018.
Well, that link at the top of this post does not correlate to the data from any of the past 2 dozen Budget statements.
But it does provide link to source data at BEA.
Display stabilization row:
XXXXXXXXXXXXXXXXXXXXXXXXXXXXXXXXXXXXXXXXXXXXXXXXXXXXXX
As can be seen, actual figures have GDP far outpacing the forecasts, as well as Outlays are less than any projections, Deficit for 2018 below any of these projections.
For
NOTIFY: Y | REPLY | REPLY WITH QUOTE | PERMALINK | TOP | HOME
Reposted for top of the page reference:
Updated with some 2018 data from CBO.
Budget.
Quote:
Originally posted by JEWELSTAITEFAN:
This is a repost from 18 May, with Budget Deficit, Actual Deficit, Federal Debt, and GDP. The Excess column is the amount the Debt exceeds the GDP.
I keep Forgetting how convoluted, twisted, and fabricated the figures are regarding the Federal Debt. The Gross Federal Debt, the Public Federal Debt, and the annual Deficits of the Federal Budgets do not add up, even when all are on the Fiscal Year cycle. OMB, CBO, Treasury, BEA, use different data, often not meshing.
So I will lay out some more data, for reference.
This helps show that, although the Rock-The-Vote Democraps doubled the Deficit in FY2008, Obama still only inherited a Debt about 2/3 of the GDP, and then was able to, in a few short years, push the Federal Debt over the GDP by 2012, and grew the excess to more than $1 Trillion over the GDP.
Once upon a time, reasonable people explained that a Debt larger than GDP was not a sustainable situation, and then Obamanomics took us there. And then after FY2012 ended, he was reelected to make the Economy even worse. While simultaneously bloating the Debt even further.
Obviously, CBO uses Libtard projection practices, so score any reasonable Budget with less Revenue, more Outlays, more Deficit, and lower GDP.
CBO scores delusional Libtard Budgets with exaggerated Revenue and GDP, and overly optimisticly low Outlays and Deficit.
Federal Debt data is from U.S. Treasury. Using Gross Federal Debt.
For the section to the right, the columns are FY Increase to the Federal Debt (aka THE REAL FEDERAL DEFICIT), FY Gross Federal Debt, FY National GDP, the amount the Debt Exceeds the GDP.
For reference, here is the CBO Historical Budget data:
FscYr Revenues Outlays FedDeficit || DebtInc Fedrl Debt FY NatGDP Excess
(EST) $ 3,329 B $ 4,108 B $ 779 B || $~1255B $~ 21,461 $~20,236 B $1225 B
2017 $3316.2B $3981.6B $665.4B || $666.2B $20,205.7 $19,177.2B 1028.5B
2016 $3268.0B $3852.6B $584.7B || 1419.4B $19,539.5 $18,469.9B 1069.6B
2015 $3249.9B $3688.4B $438.5B || $325.6B $18,120.1 $17,982.9B $137.2B
2014 $3021.5B $3506.1B $484.6B || 1075.1B $17,794.5 $17,243.6B $550.9B
2013 $2775.1B $3454.6B $679.5B || $668.5B $16,719.4 $16,515.9B $203.5B
2012 $2450.0B $3536.9B 1087.0B || 1286.7B $16,050.9 $16,027.2B $023.7B
2011 $2303.5B $3603.1B 1299.6B || 1235.4B $14,764.2 $15,379.2B
2010 $2162.7B $3457.1B 1294.4B || 1652.9B $13,528.8 $14,798.5B
2009 $2105.0B $3517.7B 1412.7B || 1889.8B $11,875.9 $14,414.6B
2008 $2524.0B $2982.5B $458.6B || 1035.4B $09,986.1 $14,752.4B
2007 $2568.0B $2728.7B $160.7B || $499.3B $08,950.7 $14,322.9B
2006 $2406.9B $2655.1B $248.2B || $546.1B $08,451.4 $13,684.7B
2005 $2153.6B $2472.0B $318.3B || $550.6B $07,905.3 $12,888.9B
2004 $1880.1B $2292.8B $412.7B || $594.7B $07,354.7 $12,088.6B
2003 $1782.3B $2159.9B $377.6B || $561.6B $06,760.0 $11,332.4B
2002 $1853.6B $2010.9B $157.8B || $428.5B $06,198.4 $10,876.9B
2001 $1991.1B $1862.8B +128.2B || $141.2B $05,769.9 $10,564.6B
2000 $2025.2B $1789.0B +236.2B || $023.2B $05,628.7 $10,148.2B
1999 $1827.5B $1701.8B +125.6B || $127.3B $05,605.5 $09,510.5B
1998 $1721.7B $1652.5B +069.3B || $109.0B $05,478.2 $08,954.8B
1997 $1579.2B $1601.1B $021.9B || $187.7B $05,369.2 $08,483.2B
1996 $1453.1B $1560.5B $107.4B || $260.9B $05,181.5 $07,978.3B
1995 $1351.8B $1515.7B $164.0B || $277.3B $04,920.6 $07,583.4B
Display stabilization row:
XXXXXXXXXXXXXXXXXXXXXXXXXXXXXXXXXXXXXXXXXXXXXXXXXXXXXX
Quote:
Once I add in FY2018 figures, we should see that with Deficit growth slowing, GDP growth exploding, the Excess will be well under $1 Trillion for the first time since Obama raced to get there.
Compared to the Brink of Economic Nightmare Horror that Obama brought us to, this now shows promise, hope, a light at the end of the tunnel, and a reversal of the path we were on.
Obama's trajectory has been Trumped.[/quNOTIFY: Y | REPLY | REPLY WITH QUOTE | PERMALINK | TOP | HOME
Quote:This bot is still broken, continuing to deny reality.
Originally posted by second:
In case there were any remaining doubts about whether Trump's tax cut would pay for itself, it hasn't.
The massive 27 percent deficit increase from last year is only expected to worsen as Trump's $1.5 trillion tax plan from a year-and-a-half ago fails to "pay for itself" as the White House previously claimed.
www.newsweek.com/conservatives-criticize-republican-federal-deficit-tr
ump-spending-record-congress-debt-tax-cuts-1454024
Relying upon ultra-retarded journalists to cypher your Maths for you is not a winning strategy.
Quote:
Originally posted by second:Quote:JewelStaiteFan, show me that fake news story with the $1 Trillion savings. I got stories that say there are no savings:
Originally posted by JEWELSTAITEFAN:
You should try reading the news sometime. Even the Deep State admits that Trump's Tax Reform will be saving more than a $Trillion in the next 15 years.
The projections of Dem disaster was already in the Budgets from Obama, no new or further updates were needed. But Trump has vastly reduced those.
The Fake News story from the Deep State CBO:
http://fireflyfans.net/mthread.aspx?bid=18&tid=61505&mid=10534
14#1053414
Today CBO released its Analysis of Trump's FY2019 Federal Budget.
To reconcile it's prior projections with Reality it had to begrudgingly increase the Revenues, decrease the Outlays, Deficit, and Debt, and increase the GDP - at least for FY2018. And these revisions are compared to the delusions they persisted with as of LAST MONTH, or 7 weeks ago.
https://www.cbo.gov/publication/53884
The CBO report is from April 2018, which was delayed from January due to the legislation passed in November 2017, February, March 2018. It only includes non-legislative factors up to mid-February. It is https://www.cbo.gov/publication/53651
For comparison, I'll post on the same Table as Trump's projections.
The left has President's Federal Budget, FY2019, and then the CBO estimates from April 2018, and then the CBO Analysis from May 2018:
Year Rvnu Outl Defct NtGDP || CBRv CBOt CBD CBGDP || CBR CBOt CDOD CBGDP
2028 5818 6181 363 32602 || 5520 7046 1526 29803 || 5264 6351 1087 29803
2027 5506 5955 450 31089 || 5299 6615 1316 28677 || 5063 6029 $965 28677
2026 5231 5748 517 29647 || 5002 6322 1320 27608 || 4886 5778 $893 27608
2025 4946 5526 579 28253 || 4663 6015 1352 26595 || 4659 5553 $895 26595
2024 4675 5348 672 26900 || 4444 5688 1244 25583 || 4446 5305 $859 25583
2023 4386 5160 774 25605 || 4228 5500 1273 24621 || 4232 5202 $971 24621
2022 4089 4941 852 24369 || 4012 5288 1276 23716 || 4016 5055 1039 23716
2021 3838 4754 916 23194 || 3827 4949 1123 22872 || 3830 4775 $945 22872
2020 3609 4596 987 22067 || 3678 4685 1008 22034 || 3682 4548 $866 22034
2019 3422 4407 984 21003 || 3490 4470 $981 21136 || 3493 4448 $955 21136
2018 3340 4214 873 20029 || 3338 4142 $804 20103 || 3339 4131 $792 20103
2017 3316 3982 665 19177 || 3316 3982 $665 19178 || 3316 3982 $665 19178
In the left section, Trump's Budget, compared to Obama projections:
The Revenue projections are reduced from the exaggerated amounts Obama assumed. Deficits upcoming are increased due to more realistic projections. For 2017 the figures were updated from Obama's base projections and last year corrections. Trump's GDP is revised up, and Expenditures are revised down.
Trump's Budget accumulates $8.632 Trillion in Deficits by 2028.
Indicating the Federal Debt would add about $13 Trillion in that period.
Which holds true to historical practice. Democrats always exaggerate or overestimate Revenues and downplay or underestimate Expenditures, and Conservative Republicans always underestimate Revenue projections and overestimate Expenditure projections (but Democrats then find some pork to fill in the difference).
In the middle section, the CBO projections:
The Liberal biased practi
NOTIFY: Y | REPLY | REPLY WITH QUOTE | PERMALINK | TOP | HOME
Quote:JewelStaiteFan, the Federal Reserve says you are a numbskull. The investment community says you are a numbskull.
Originally posted by JEWELSTAITEFAN:
Relying upon ultra-retarded journalists to cypher your Maths for you is not a winning strategy.
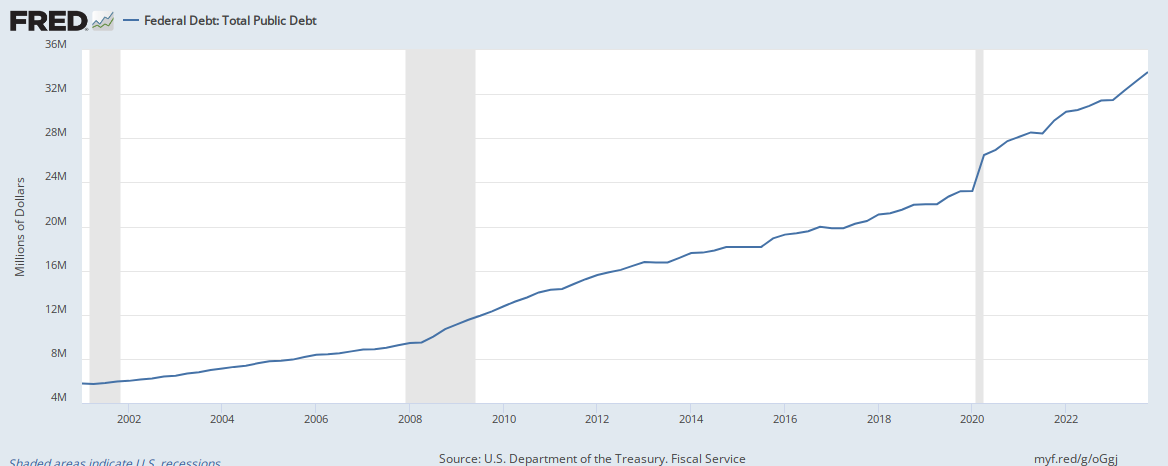
Donald Trump promised he would eliminate the nation’s debt in eight years. Instead, his budgets will add $9.1 trillion during that time.
www.investopedia.com/updates/usa-national-debt/
The Federal Reserve can clarify that Trump is steadily increasing the debt:
https://fred.stlouisfed.org/graph/?g=oGgj
The Joss Whedon script for Serenity, where Wash lives, is Serenity-190pages.pdf at www.mediafire.com/folder/1uwh75oa407q8/Firefly
NOTIFY: Y | REPLY | REPLY WITH QUOTE | PERMALINK | TOP | HOME