

Some Covid-19 thoughts
POSTED BY: captaincrunch
UPDATED: Monday, September 29, 2025 18:59
VIEWED: 301579
PAGE 250 of 384

NOTIFY: N
| REPLY
| REPLY WITH QUOTE
| PERMALINK
| TOP
| HOME
https://pbs.twimg.com/media/E32bpsdVoAYafdU
If I was going to graph this, I'd do it as a linear regression and calculate the r^2 value.
As it is, the most convincing data to me is the upper right-hand quadrant, convincing by its emptiness. The lower left-hand quadrant is also somewhat noticeable by its relatively emptiness, but it's not as dramatic. In all, those 2 quadrants that run counter to expectation (the expectation is: more vaccinations -> fewer cases) account for 17 out of 50 states plus DC.
As for 'red states' v 'blue states', if you believe this map, 13 out of 50 are split control. 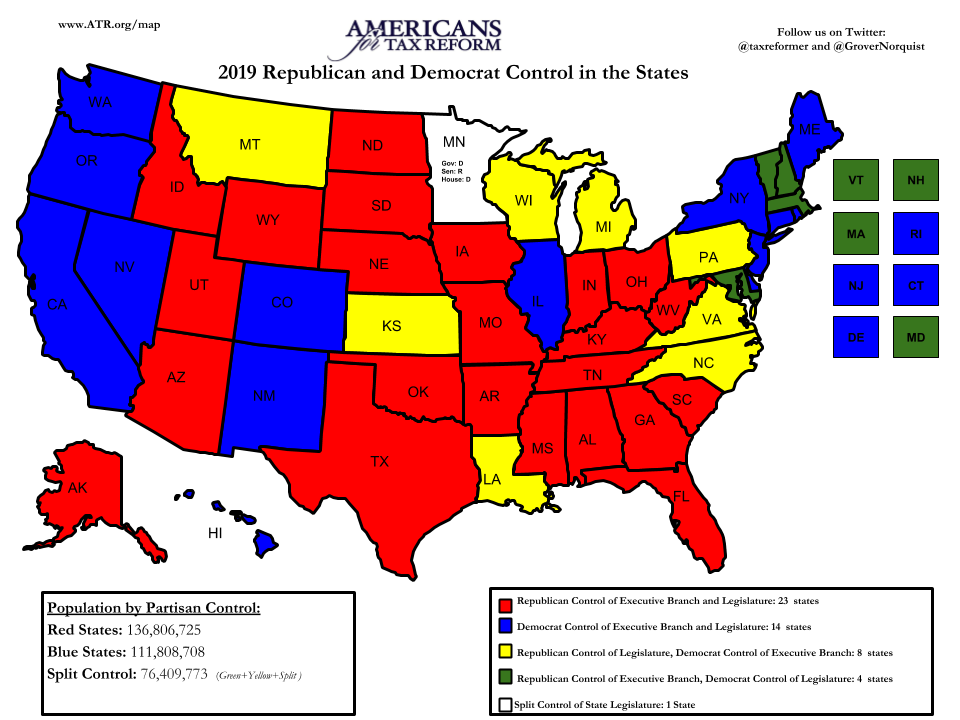
Combining datasets:
blue state red state mixed governance
+V = increased vaccinations -V = decreased vaccinations
+C = increased cases -C = decreased cases
How many states adopted blue state or red state vaccination policies? Do blue state vaccination policies give expected blue state results? Do red state vaccination policies give expected red state results?
Blue states are
RI +V-C
CT +V-C
NJ +V-C
DE +V-C
NY +V-C
IL +V-C
CA +V-C
NM +V-C
HI +V-C
CO +V+V+C
WA +V+C
OR +V

Thats useful. (I assume WI wuz a typo)
But even here in IL, we got a lot uv Trump Gullibullz. Many uv my nayborz!
----------------------------
DUZ XaT SEM RiT TQ YQ? - Jubal Early
The real pandemic solution: http://uvpk.net/
NOTIFY: Y | REPLY | REPLY WITH QUOTE | PERMALINK | TOP | HOME
Quote:
Originally posted by second:
In a series of definitive pieces that earned him the 2021 Pulitzer Prize for explanatory reporting, The Atlantic’s Ed Yong anticipated the course of the coronavirus pandemic, clarified its dangers, and illuminated the American government’s disastrous failure to curb it.
Thanks. Exellent article and video.
----------------------------
DUZ XaT SEM RiT TQ YQ? - Jubal Early
The real pandemic solution: http://uvpk.net/
NOTIFY: Y | REPLY | REPLY WITH QUOTE | PERMALINK | TOP | HOME
Quote:
Originally posted by 1KIKI:
https://pbs.twimg.com/media/E32bpsdVoAYafdU
If I was going to graph this, I'd do it as a linear regression and calculate the r^2 value.
As it is, the most convincing data to me is the upper right-hand quadrant, convincing by its emptiness. The lower left-hand quadrant is also somewhat noticeable by its relatively emptiness, but it's not as dramatic. In all, those 2 quadrants that run counter to expectation (the expectation is: more vaccinations -> fewer cases) account for 17 out of 50 states plus DC.
As for 'red states' v 'blue states', if you believe this map, 13 out of 50 are split control.
IMAGE REMOVED FOR FORMATTING PURPOSES
Combining datasets:
blue state red state mixed governance
+V = increased vaccinations -V = decreased vaccinations
+C = increased cases -C = decreased cases
How many states adopted blue state or red state vaccination policies? Do blue state vaccination policies give expected blue state results? Do red state vaccination policies give expected red state results?
Blue states are
RI +V-C
CT +V-C
NJ +V-C
DE +V-C
NY +V-C
IL +V-C
CA +V-C
NM +V-C
HI +V-C
CO +V+V+C
WA +V+C
ORNOTIFY: Y | REPLY | REPLY WITH QUOTE | PERMALINK | TOP | HOME
The graph was originally from the WaPo and I couldn't even pull the url from the website, so I had to go to gibiru to get it from somewhere. It was literally the only link I found. I know this website doesn't auto-load the pix. But at least there's a link!
I picked my terms badly - they should be 'less than average vaccination rates', or 'greater than average vaccination rates'. I hope the + and - signs do convey the ideas I intended at least.
My preferred graph as I indicated would have done a linear regression with regression statistics. Failing that, I was trying to figure out a visually simple way of representing the data, so that it would be easy to see the gist of the trends at a glance.
As for interpreting the data, I've been following the trends here in CA and elsewhere, trying to get a good understanding of the various measures that have been taken, and their effects on cases and deaths. But it's not like a seesaw, with clear action/ effects. It's extremely 'yubby'. Overall one can see that superspreader events - like national holidays - lead to increased cases over time, which leads to increased deaths over time. But looking at CA and a particular example, mask mandates, maybe they kinda' sorta' worked. But compliance rates were low especially in SoCal - in LA City proper estimated to be less than 50% by visually surveying people on the street. And LA City numbers were driving a fair bit of the SoCal numbers. So there was a lot of nominal action statewide, but not actual action in all places. So, tracking various measures and their effects on a population isn't that straightforward.
And the figures from the WaPo graph obviously don't trace all possible inputs into the numbers, just vaccination rates. I think the situation is a lot more complicated than a single input (vax rates). Anyway, I can imagine situations where higher than average vaccination rates are accompanied by increased cases, for example, if there were serious restrictions that were suddenly lifted. Higher than average vaccination rates could still not be sufficient to create herd immunity, but lowered restrictions could create more cases.
I might post this part again for JO specifically, but I did want to point out that the WaPo graph is a past instantaneous snapshot of an ongoing live stream. Those numbers will change; some of them may even have already flipped into a different category. For example, I keep seeing commercials featuring Alaska governor Mike Dunleavy trying to entice people to vacation in Alaska because it has one of the highest vaccination rates in the country; and so by implication it's safe going there. But if AK really is in that category now, that's not what's represented on the WaPo graph.
When it comes to the graph and my post, overall, given the lack of regression and stats, I was really just trying to figure out a way to visually interpret the WaPo graph in a clear, easy to interpret representation.
NOTIFY: N | REPLY | REPLY WITH QUOTE | PERMALINK | TOP | HOME
I keep hearing warp speed. Pfizer didn't participate in that program and they had the first best vaccine. The others followed right behind them. That's due to the seriousness of the virus, the need for a vaccine, and the pharmaceutical companies realizing the money to be made.
These reasons were more responsible for the vaccines fast development. That and the fact that we had already been researching a faster way to create vaccines for covid outbreaks. We saw this coming for decades and we were ready. It’s my opinion if warp speed contributed at all to the development of the vaccine it was in a minimal way.
Trump also dissolved Obamas’ team that was set in place to get ahead of any virus outbreaks globally. They were professionals in the medical field. The team was designed to be a fast reaction squad that could respond to any need that would arise, like a lack of PPE.
Any posts here supporting Trumps efforts are meaningless because history is already writing how badly Trump fucked up. Not just with the virus by with everything he touched. All one need do is reread this thread to see it’s all been said a thousand times.
T
NOTIFY: Y | REPLY | REPLY WITH QUOTE | PERMALINK | TOP | HOME
Even CNN gave Trump that victory, Ted.
--------------------------------------------------
Give me liberty or just come shoot me in my house. I'm so over this ridiculous reality.
NOTIFY: Y | REPLY | REPLY WITH QUOTE | PERMALINK | TOP | HOME
KIKI: and I chose my words badly. I touched on the link, but all I got was an empty page. So I "allowed" whatever scripts might have been blocked, but no chart appeared.
Anyway, I got your drift. Overall, there does seem to be a correlation between vaccinations and lower "newcases", but there are exceptions because there are so many other factors at play.
Given that only half of the population overall is vaccinated, I do wonder what happens this upcoming winter, because that's not enough for herd immunity. Some percent of that "unvaccinated" group are children under 12, but that still leaves a lot of people available to get sick, and pass it on! Also, they keep looking at the vaccine's effectiveness,and so farave tracked it to six months but for me and a lotof people that means only thru fall. So despite being vaccinated I still wear an N95 to go grocery shopping because there I'm being exposed to 200-300 people indoors, half of whom aren't vaccinated and one or two of whom might be actively sick.
H HAVE stopped wearing a paper mask outdoors. Not because I've been vaccinated but because I've waled my dog every day thru this pandemic and have passed by, and stopped to chat with, many people, and breezes, sunshine, and distance have kept me safe. Also, I'll be scheduling all my regular doctor and dentist visits again.
-----------
Pity would be no more,
If we did not MAKE men poor - William Blake
THUGR posts about Putin so much, he must be in love.
NOTIFY: Y | REPLY | REPLY WITH QUOTE | PERMALINK | TOP | HOME
You're right. It disappeared from the link. Maybe WaPo was having copyright fits?
Here's the article, but I still can't post the image found w/in.
https://www.washingtonpost.com/health/2021/06/14/covid-cases-vaccinati
on-rates/
NOTIFY: N | REPLY | REPLY WITH QUOTE | PERMALINK | TOP | HOME

In March longtime Republican pollster Frank Luntz led a focus group with Trump voters. Many of them stressed that they were not “anti-vaxxers” who opposed all vaccines. Nor were they “COVID deniers.” They acknowledged that the disease was real; many had family and friends who had had it, and some had been ill themselves. But they were suspicious of the federal government and had a sense that science was often oversold. CBS found similar results, reporting that 60 percent of respondents say “scientists have been wrong on the coronavirus most or all of the time” and that mask mandates and social distancing requirements do not help control the spread of the virus. And most of these people are Republicans. Luntz concluded the best approach would not be for Republican leaders to tout the vaccine but for apolitical messengers—a person's own doctor, say, or spouse—to offer facts in an honest, nonpartisan way.
Fair enough, but why do so many Republicans distrust government, including government science, and think scientists are “always getting it wrong”? A large part of the answer is that this is what the party's spokespeople have been saying for 40 years, from the early days of acid rain to our ongoing debates about climate change. It was Luntz himself who, more than 20 years ago, designed the Republican party's strategy to fight climate change by insisting there was no scientific consensus on the issue. It has mostly been Republican governors resisting mask mandates, even when science showed they slowed the spread of COVID-19. And it was, by and large, Republican governors lifting those mandates in the spring, even while Rochelle Walensky, director of the Centers for Disease Control and Prevention, begged them not to.
Everyone deserves accurate information to be presented in an apolitical way and to be addressed with respect and not condescension. But the reality is that most of the science that matters most comes from the government or from scientists funded by the government. Until Republican leaders stop telling voters not to trust the government, many of them won't trust science.
www.scientificamerican.com/article/the-reason-some-republicans-mistrus
t-science-their-leaders-tell-them-to/
The Joss Whedon script for Serenity, where Wash lives, is Serenity-190pages.pdf at www.mediafire.com/folder/1uwh75oa407q8/Firefly
NOTIFY: Y | REPLY | REPLY WITH QUOTE | PERMALINK | TOP | HOME